ZoomInfo Marketing OS
Project: Marketing Cloud - Dashboard & Report Module Design
Tools: Figma, Adobe Creative Suite, Jira, Hotjar
Company: zoominfo.com
Project: Marketing Cloud - Dashboard & Report Module Design
Tools: Figma, Adobe Creative Suite, Jira, Hotjar
Company: zoominfo.com
Project Goals
Dashboard
• Allow the user to quickly provide insights that will assist in identifying actions I should take, such as launching a new campaign, targeting new accounts, and modifying existing campaigns
• Allow the user to quickly provide insights that will assist in identifying actions I should take, such as launching a new campaign, targeting new accounts, and modifying existing campaigns
Report
• Independent module where users can go to view and download data from their campaign.
• As a marketer, I want to be able to slice and dice every possible metric from my campaigns directly in ZI ABM, so that I can analyze performance without having to go into any other platform
• Independent module where users can go to view and download data from their campaign.
• As a marketer, I want to be able to slice and dice every possible metric from my campaigns directly in ZI ABM, so that I can analyze performance without having to go into any other platform
Business Outcome Hypothesis
• The dashboard will enable marketers and marketing managers to review the performance of marketing activities to identify additional actions.
• The dashboard will enable marketers and marketing managers to gain insights that lead to identifying new marketing opportunities.
• The dashboard will enable marketers and marketing managers to be self-sufficient in viewing graphs and data to track the performance of campaigns.
• The dashboard will increase engagement with marketers and marketing managers so that the value gained from ZIMC will increase as well as the adaption of ZIMC in the organization.
Exploration Phase
Dashboard
KPI
• Number of audiences created or updated from the dashboard.
• Time and sessions users spend in ZIMC.
• Time and sessions users spend on the dashboard
Users and Their Needs
• Conducted extensive research to understand the diverse needs of marketing customers.
• Planning: Developed a comprehensive plan to revamp the claim process, emphasizing user-friendly interfaces and streamlined workflows.
Report
• The exploration phase for the reporting functionality focused on understanding user needs for data customization and the technical requirements for integrating various data sources into a singular, easy-to-use platform.
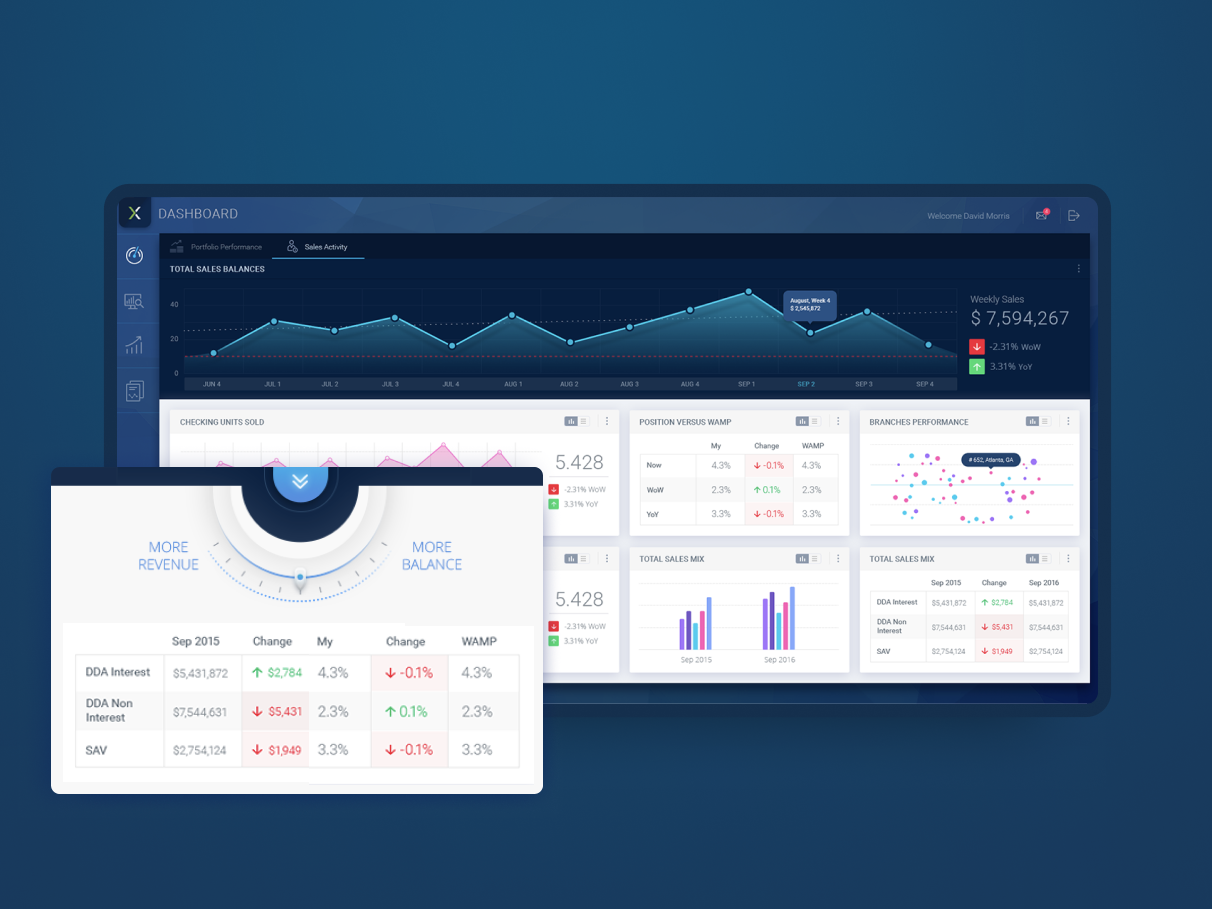
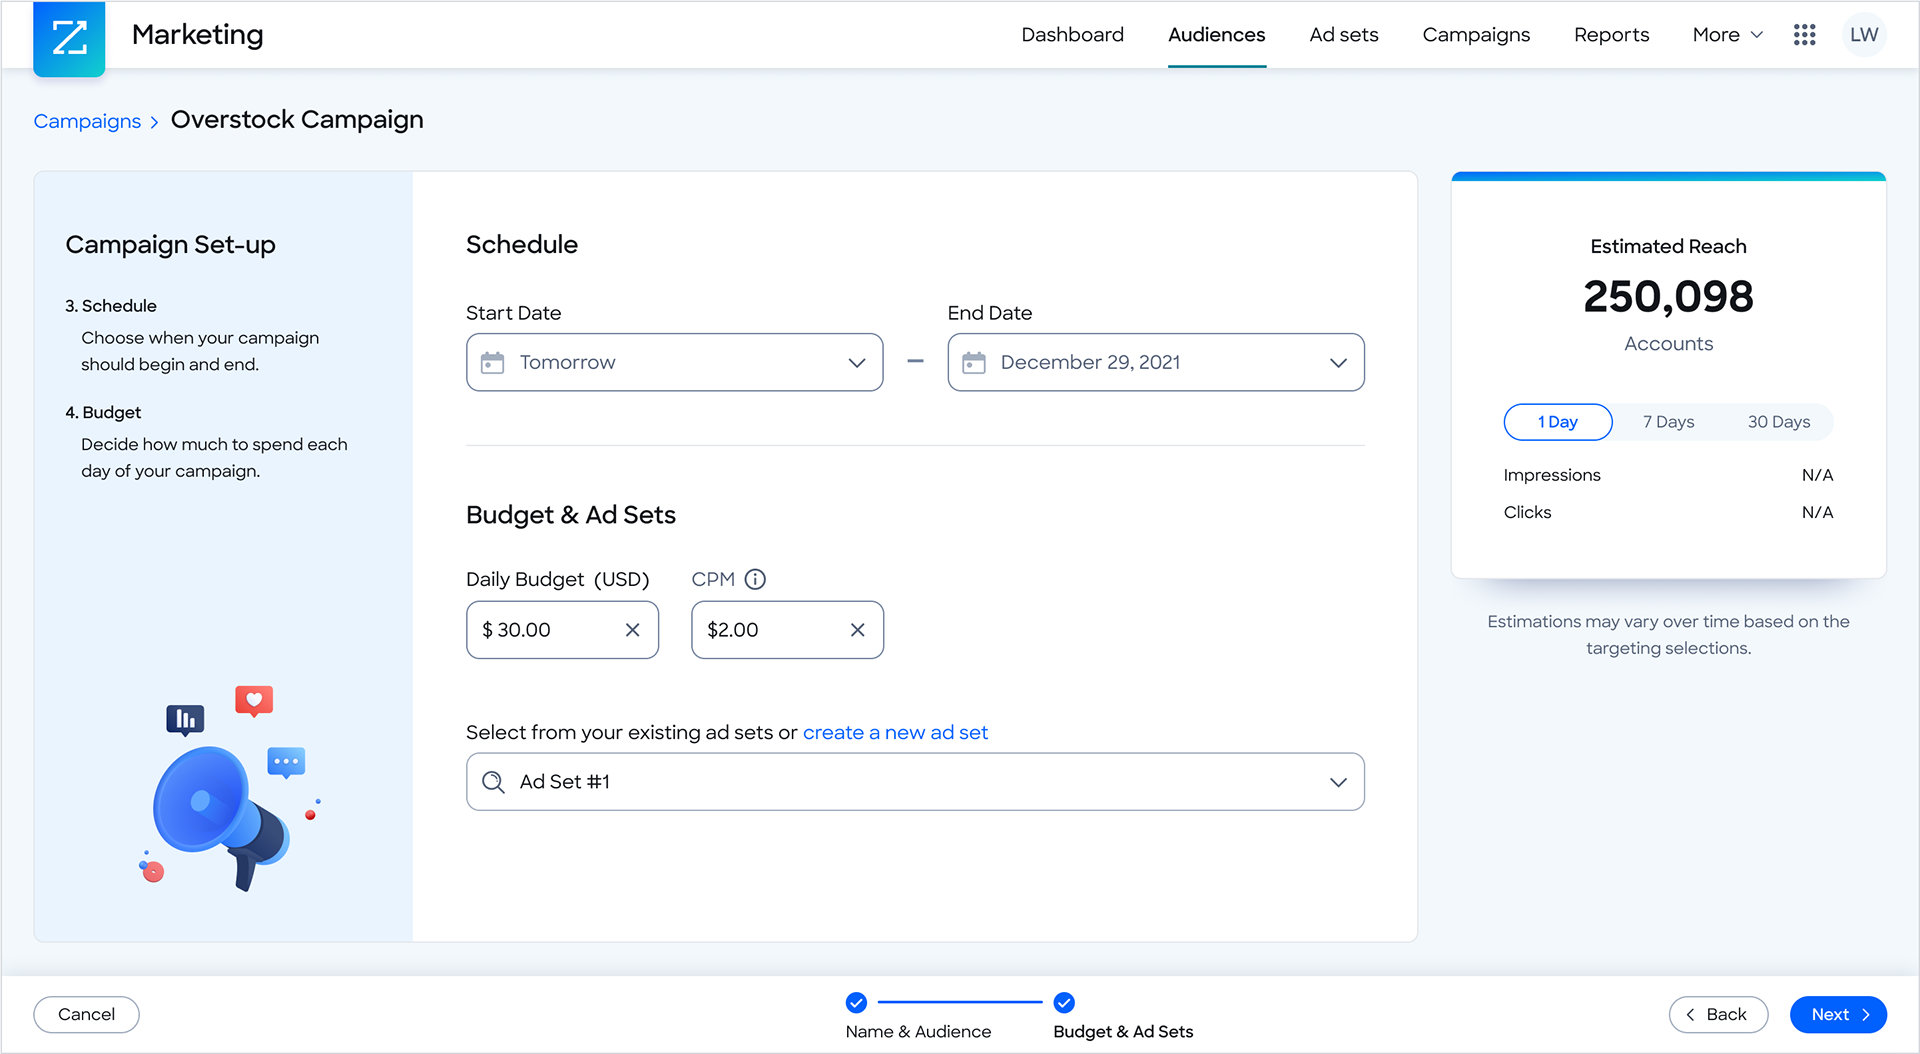
Solution
The new dashboard offers a dynamic view of marketing performance, with customizable data tiles and graphs that enable marketers to quickly grasp campaign effectiveness, identify trends, and make informed decisions.
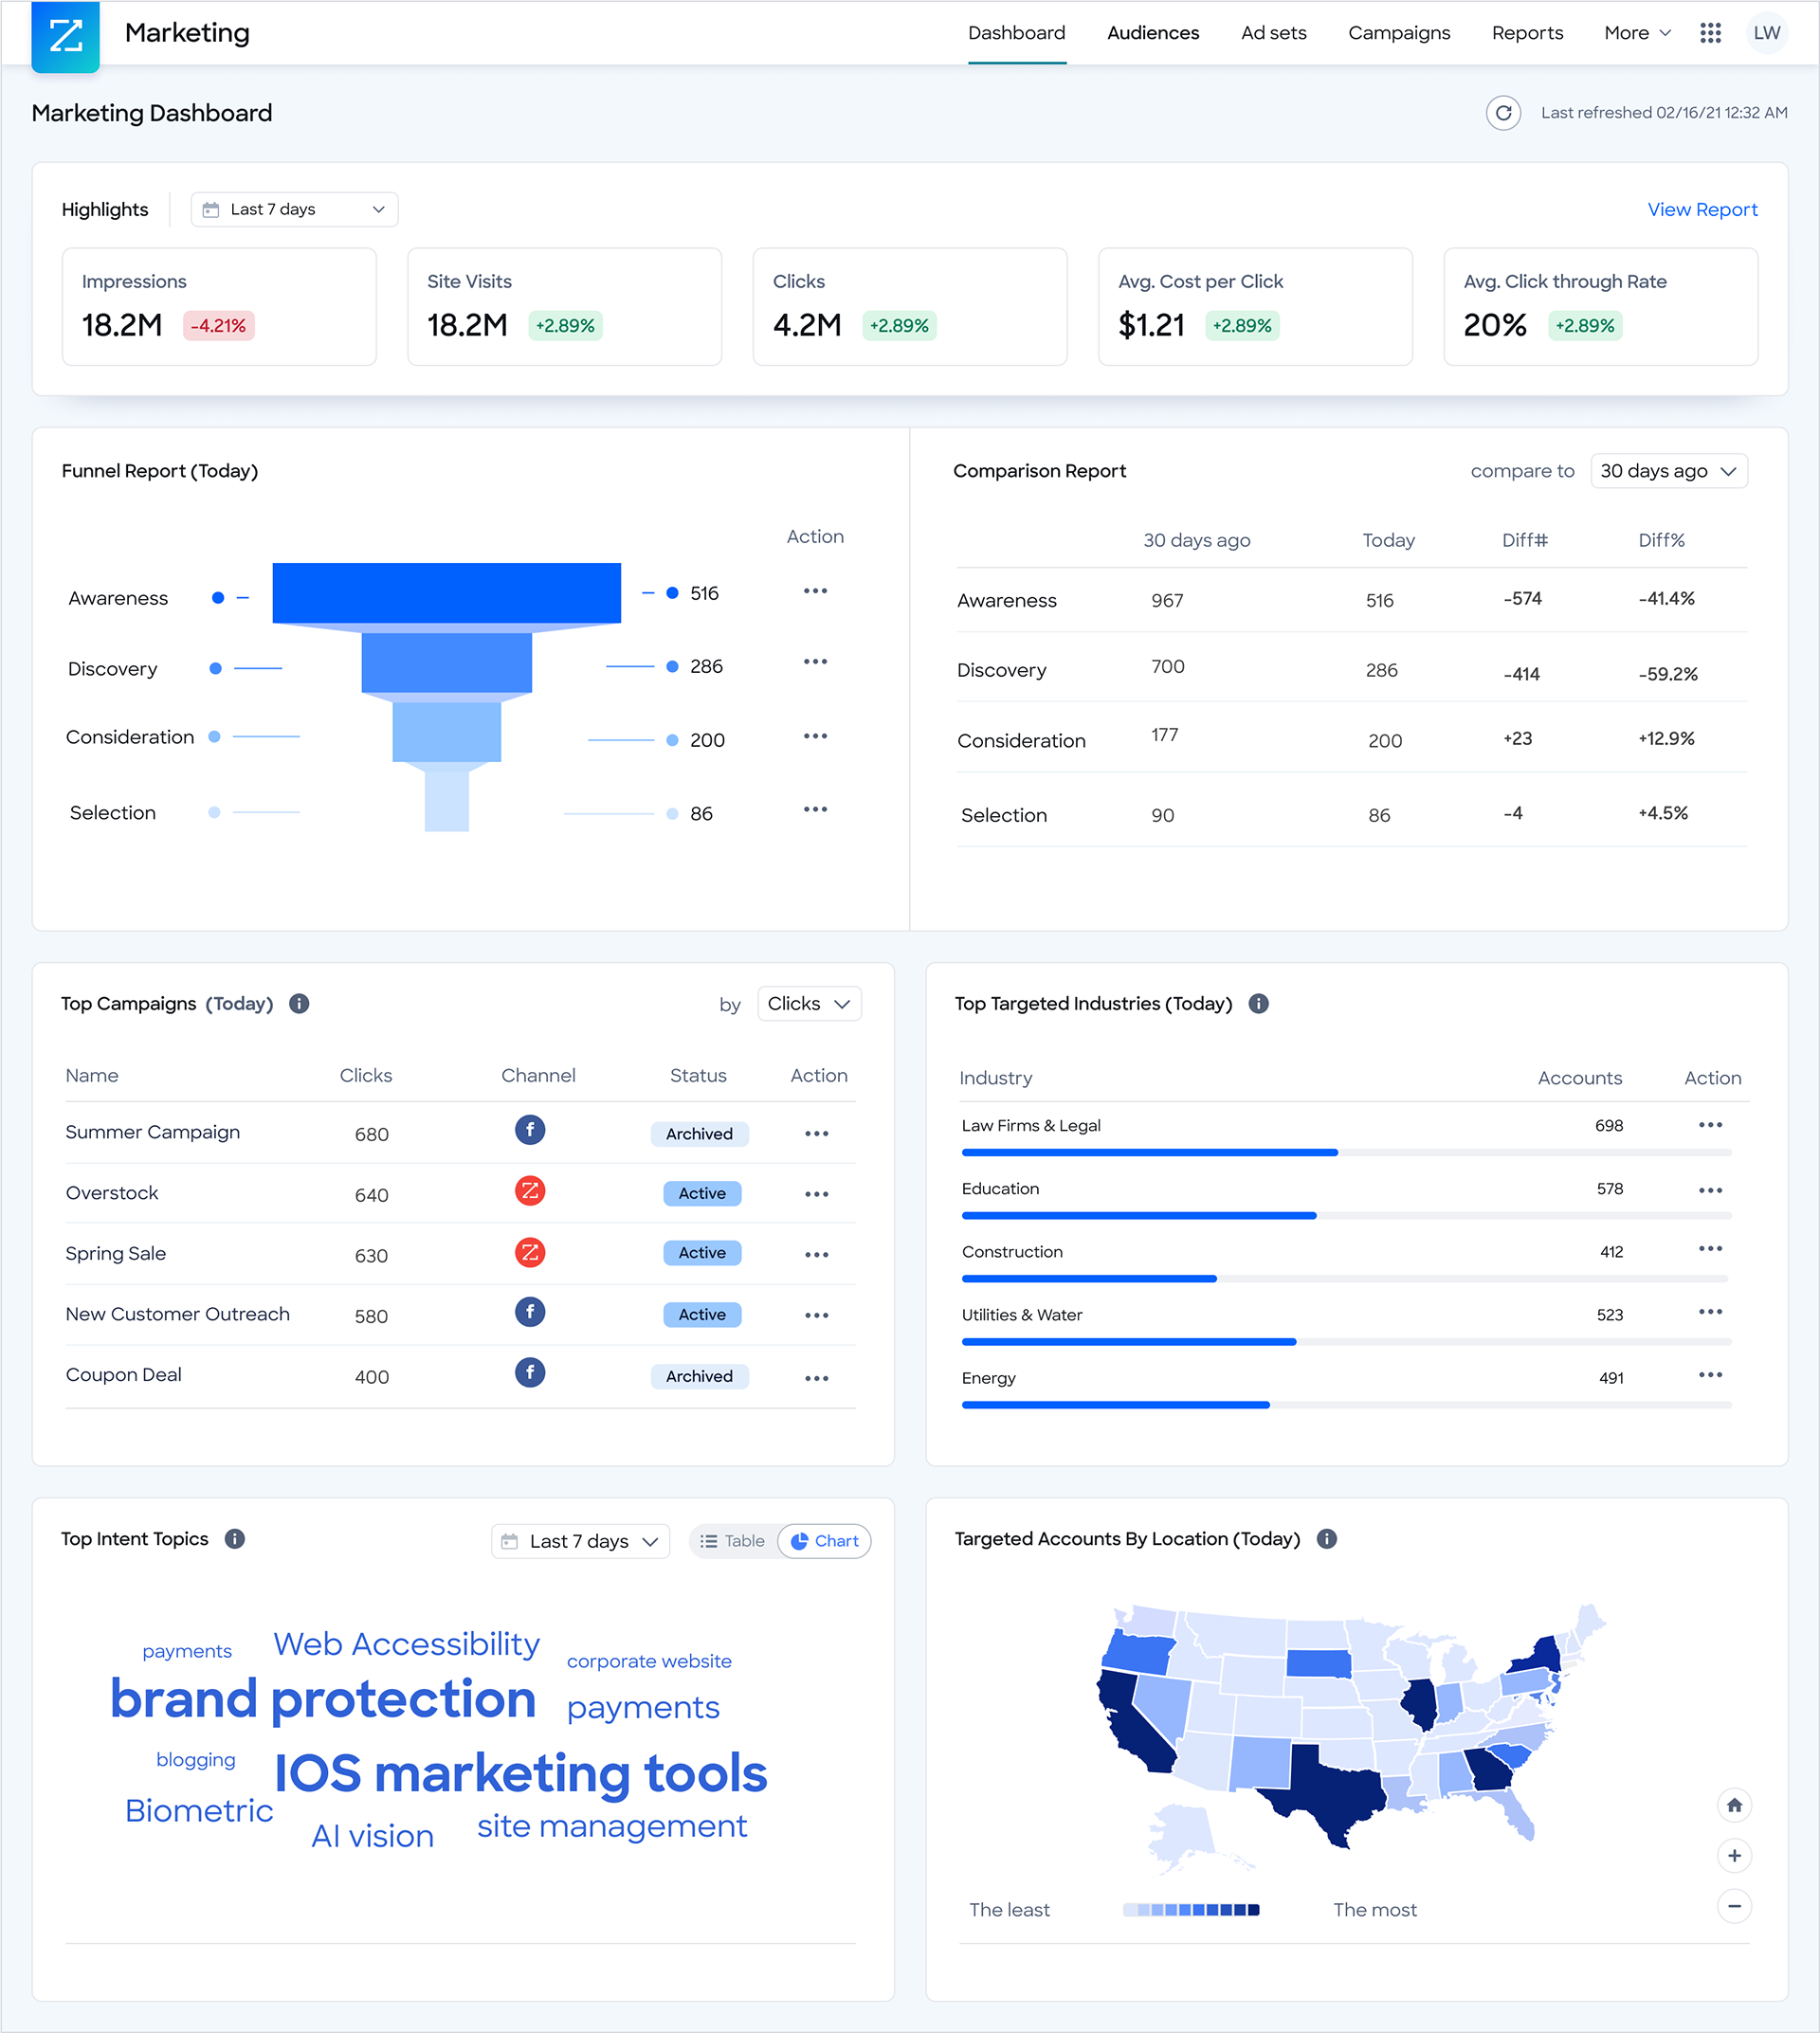
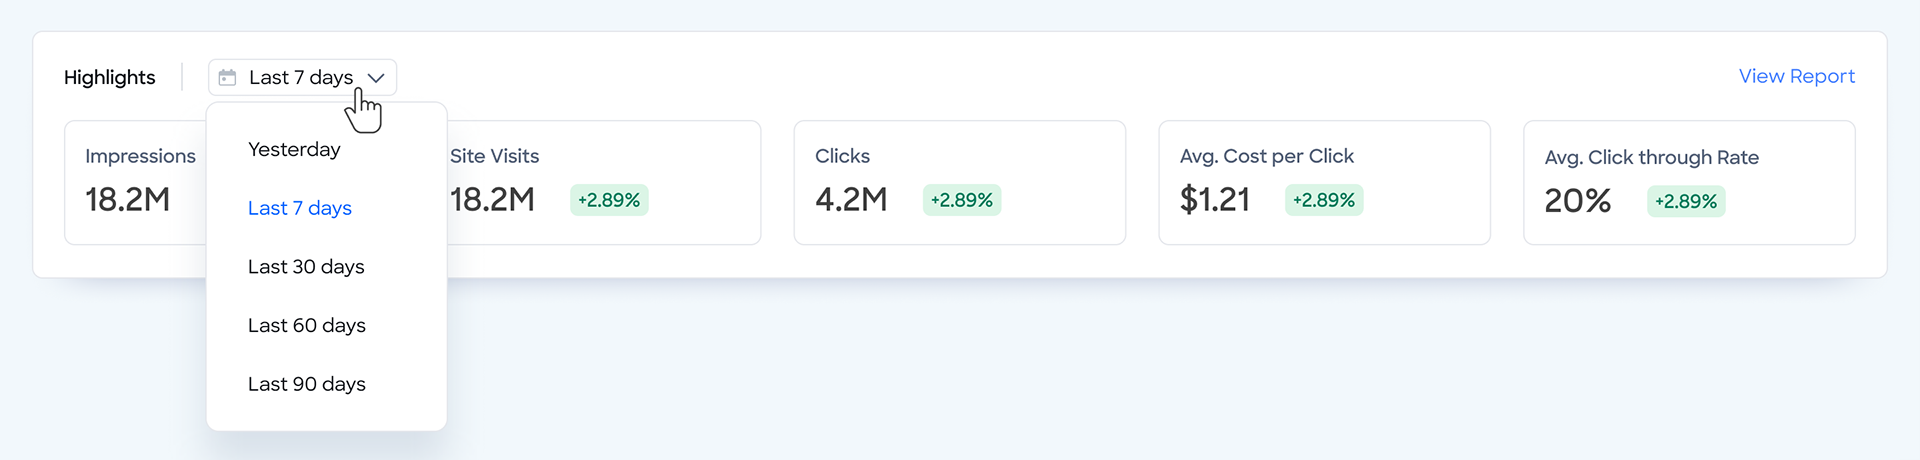
Data Tiles
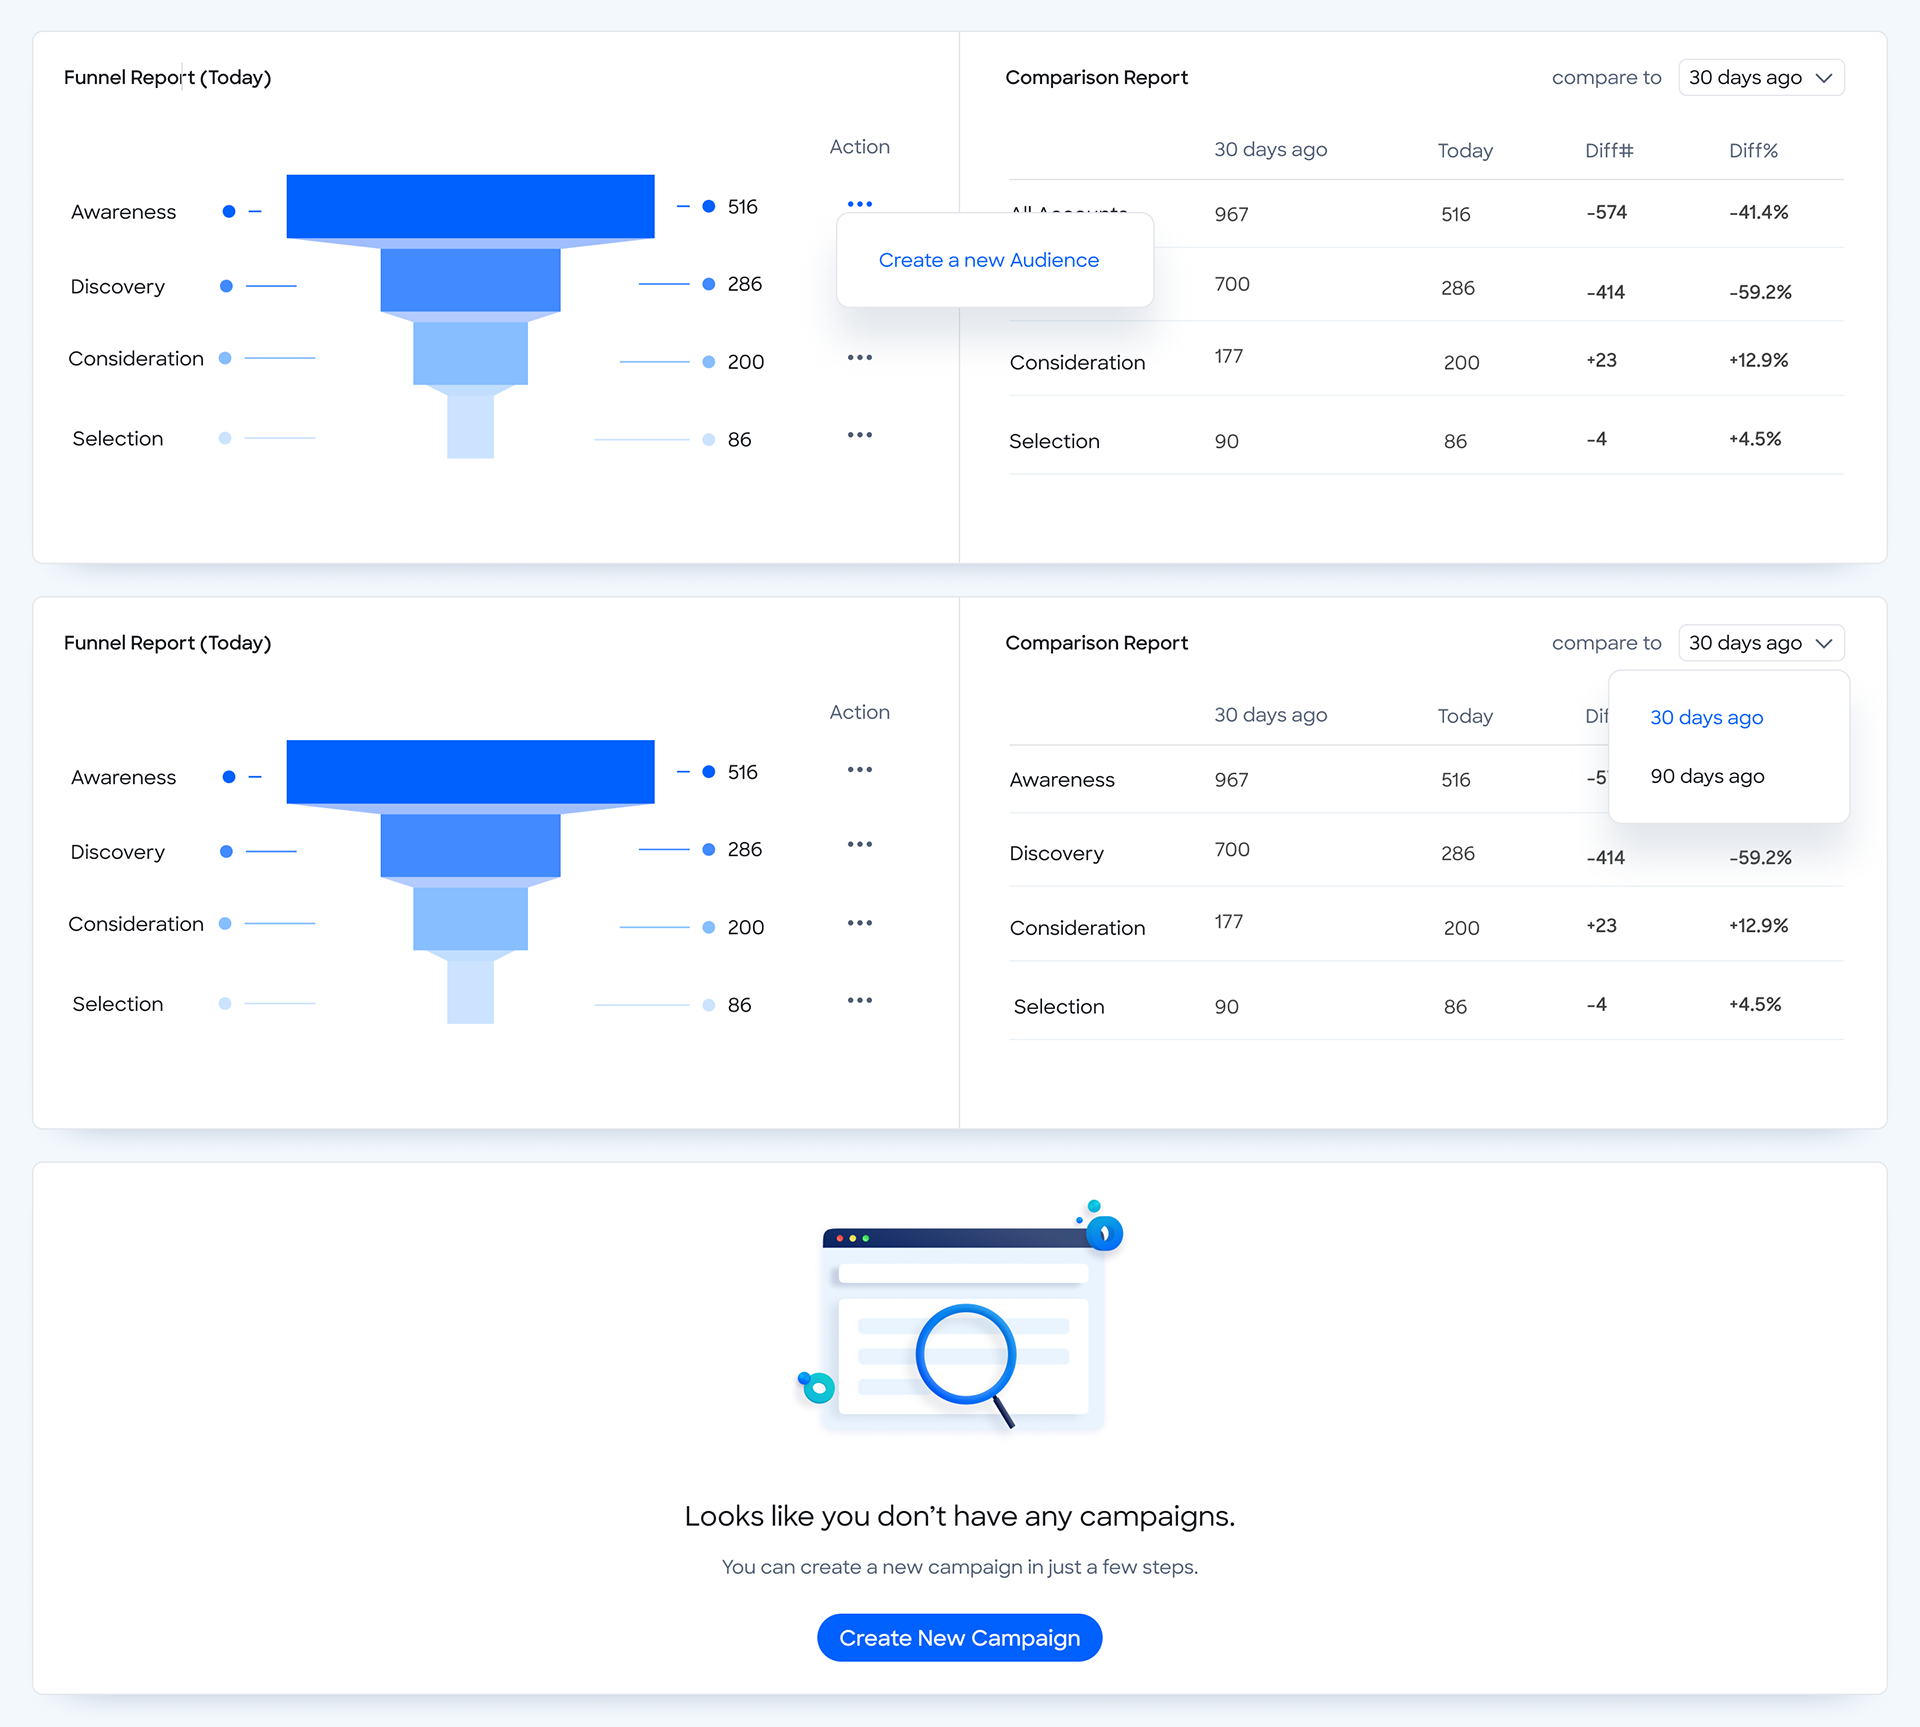
Funnel Report
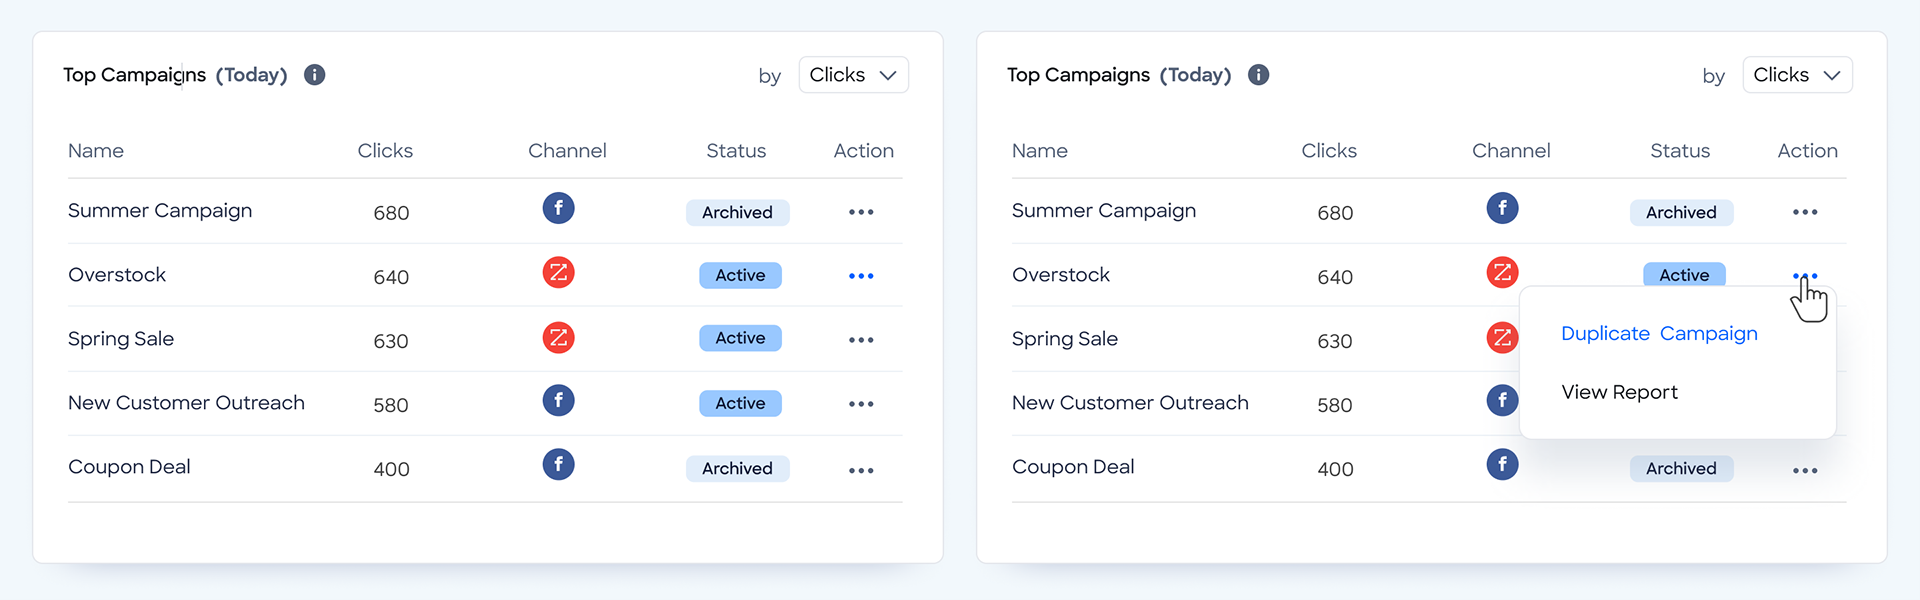
Top Campaign
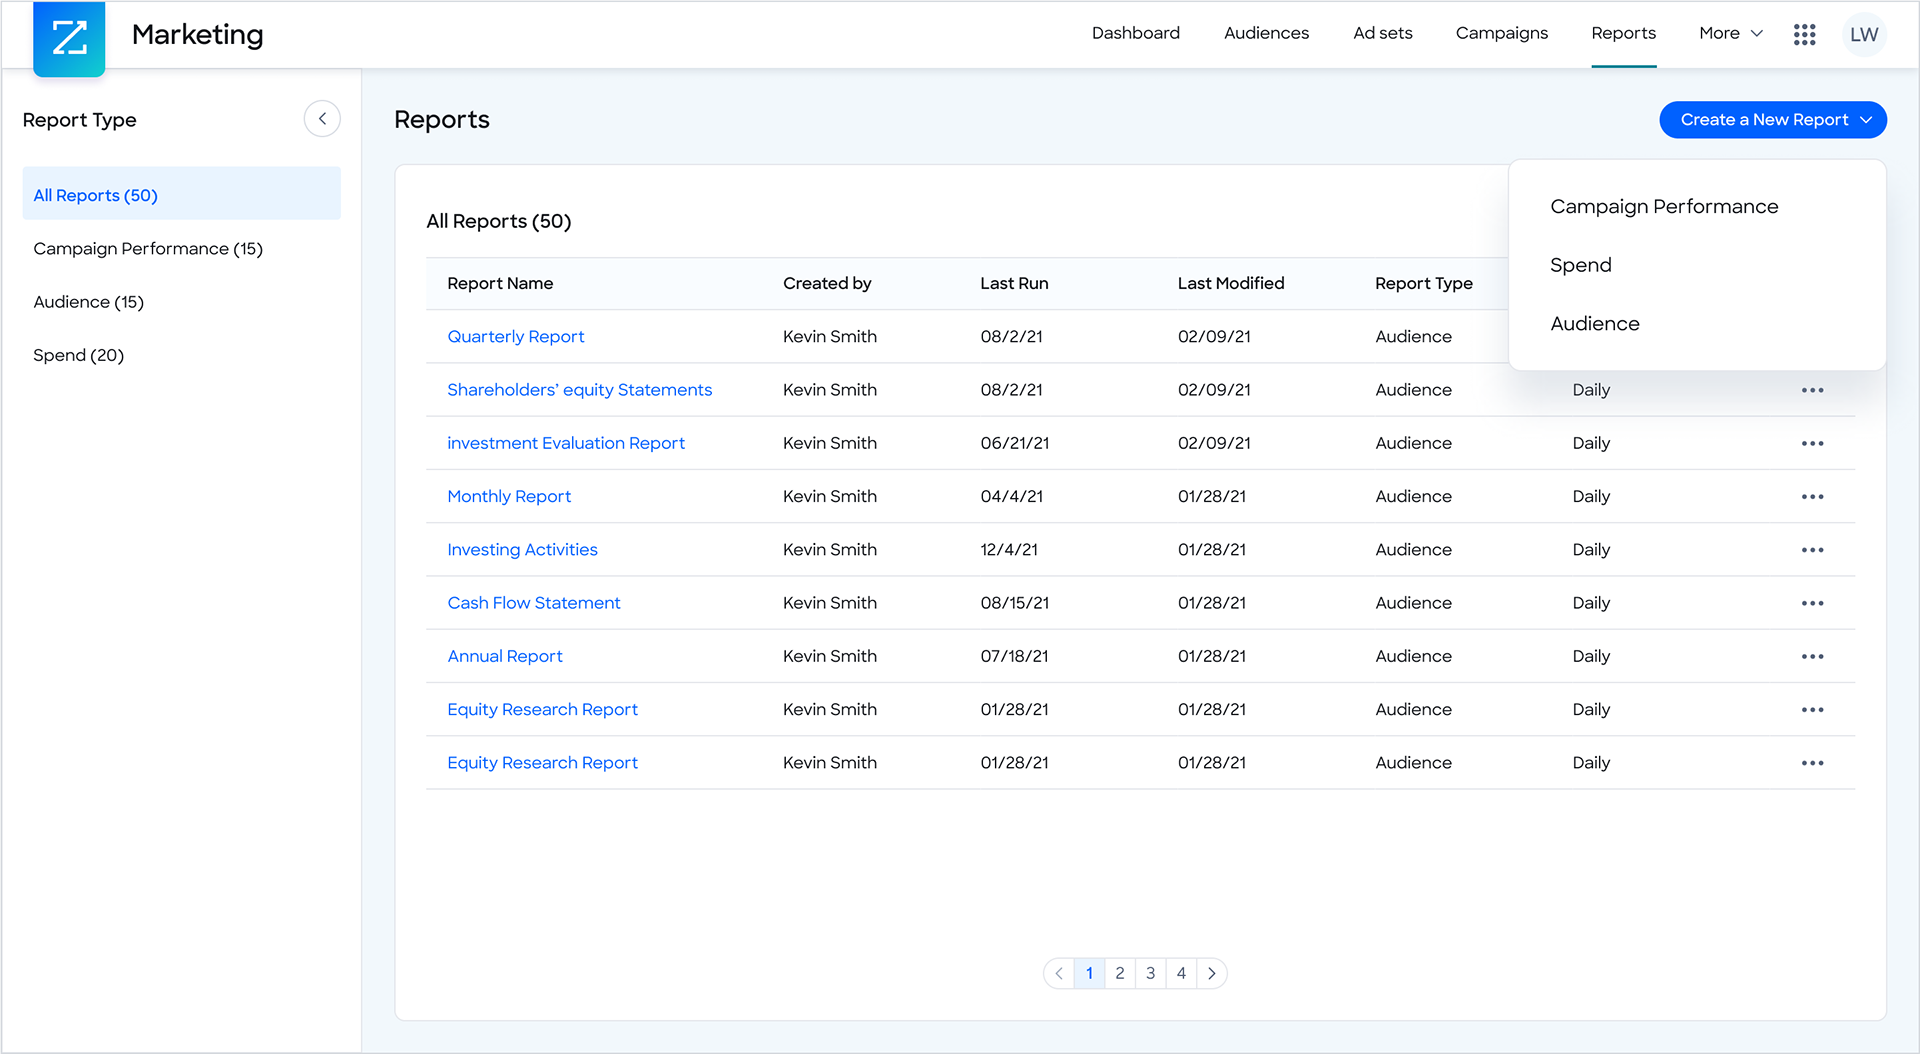
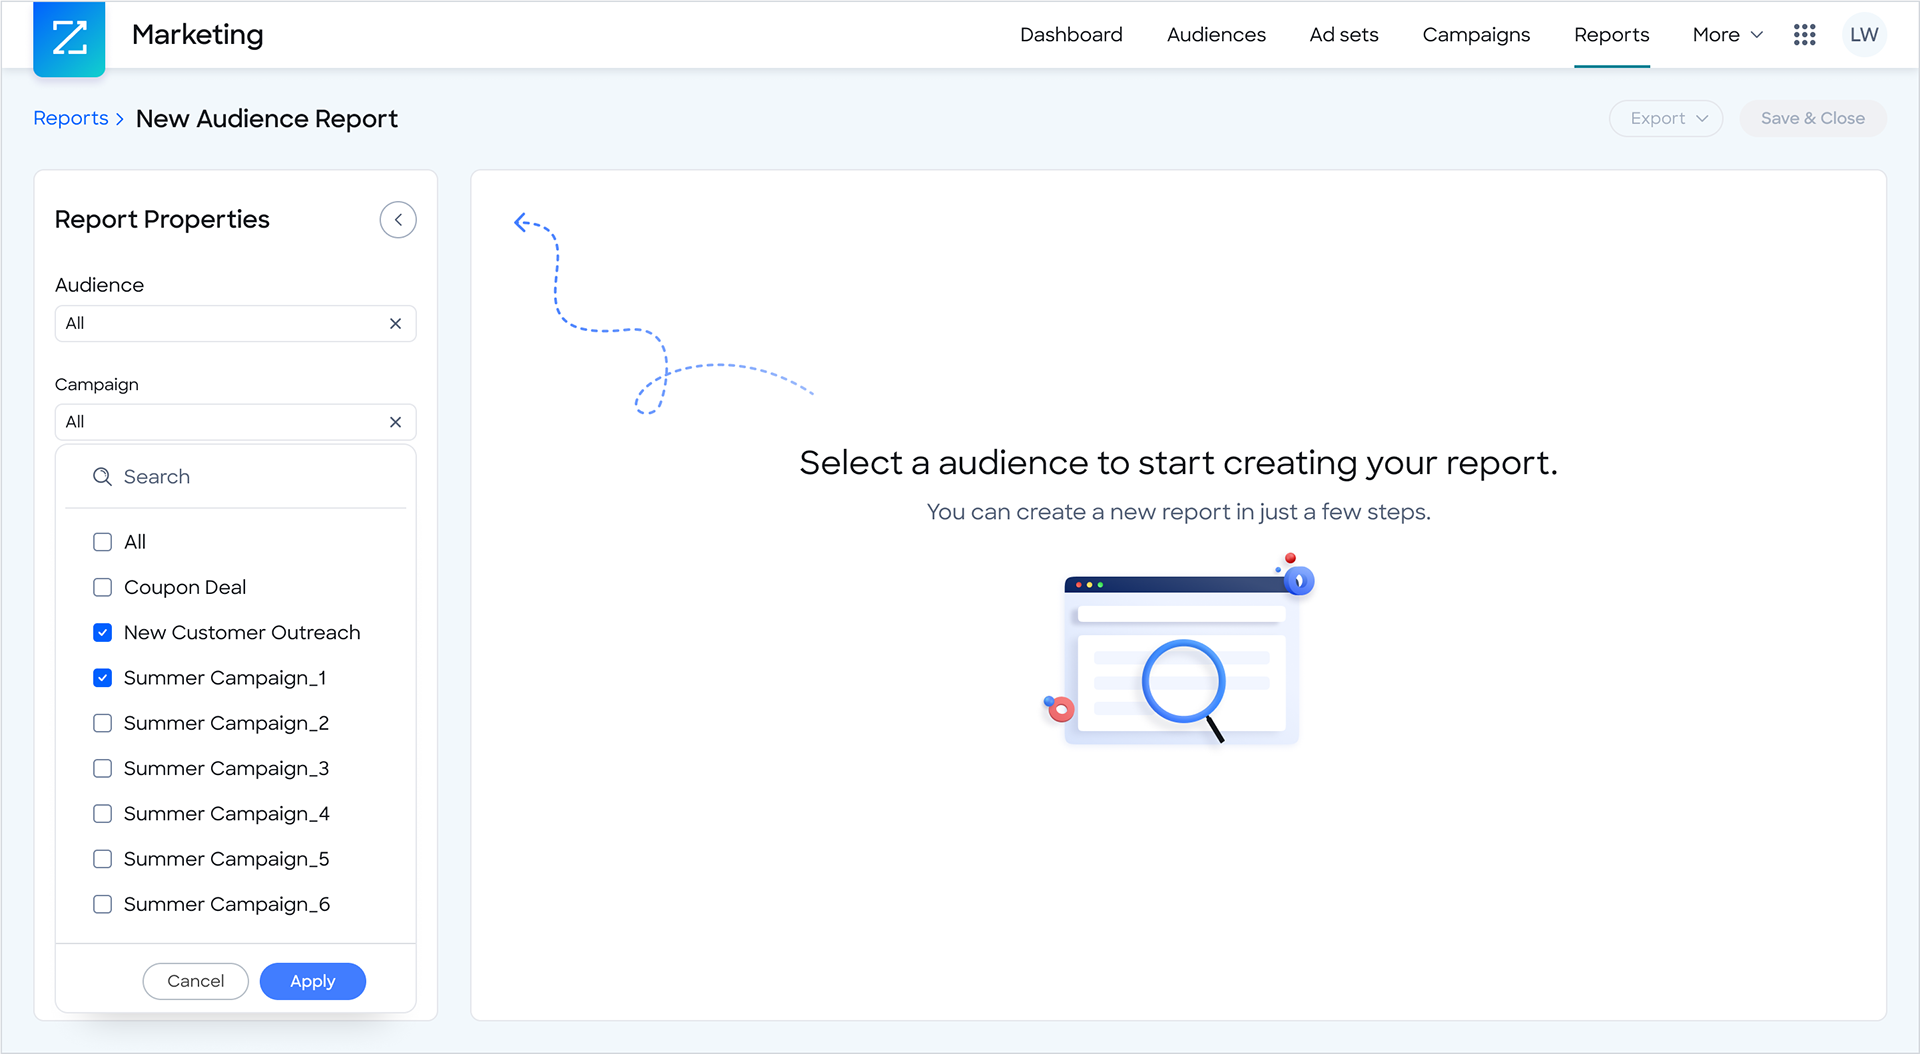
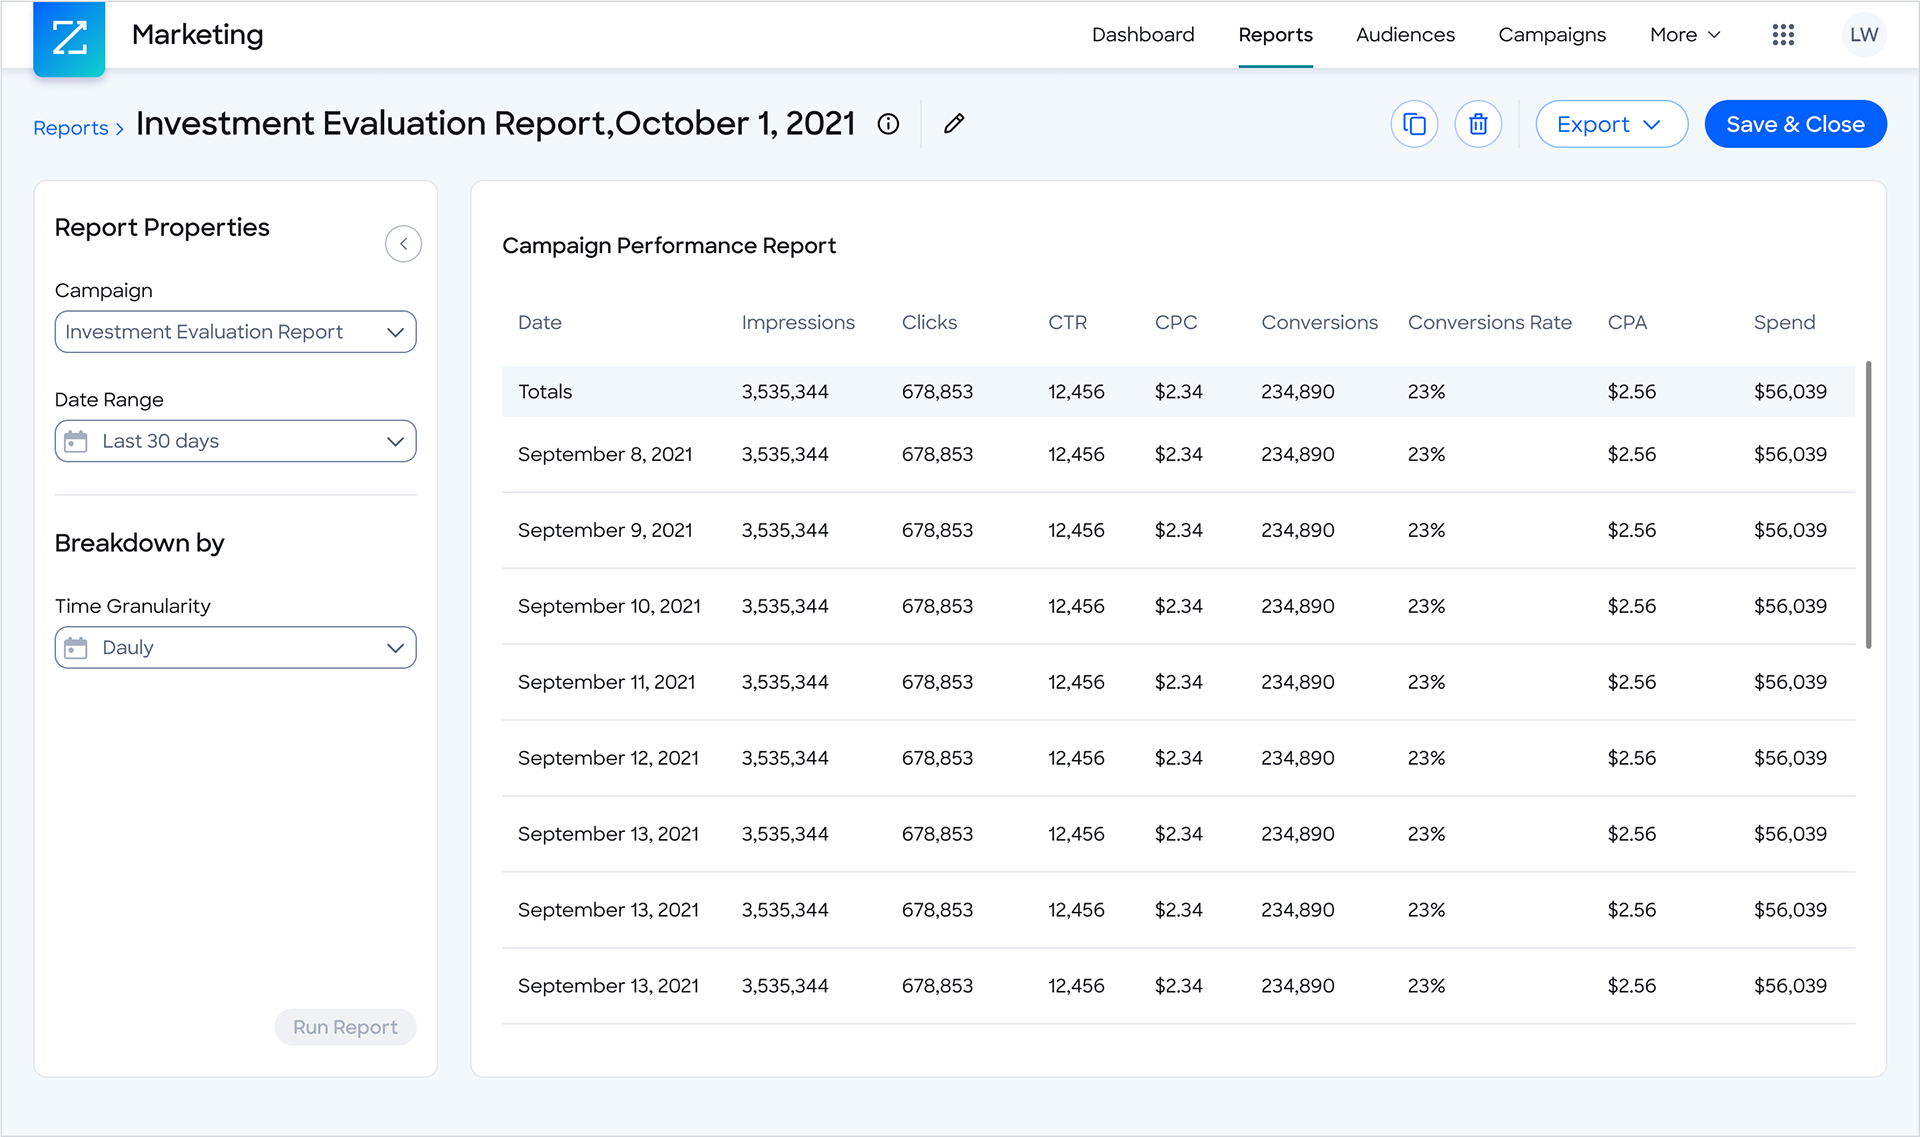
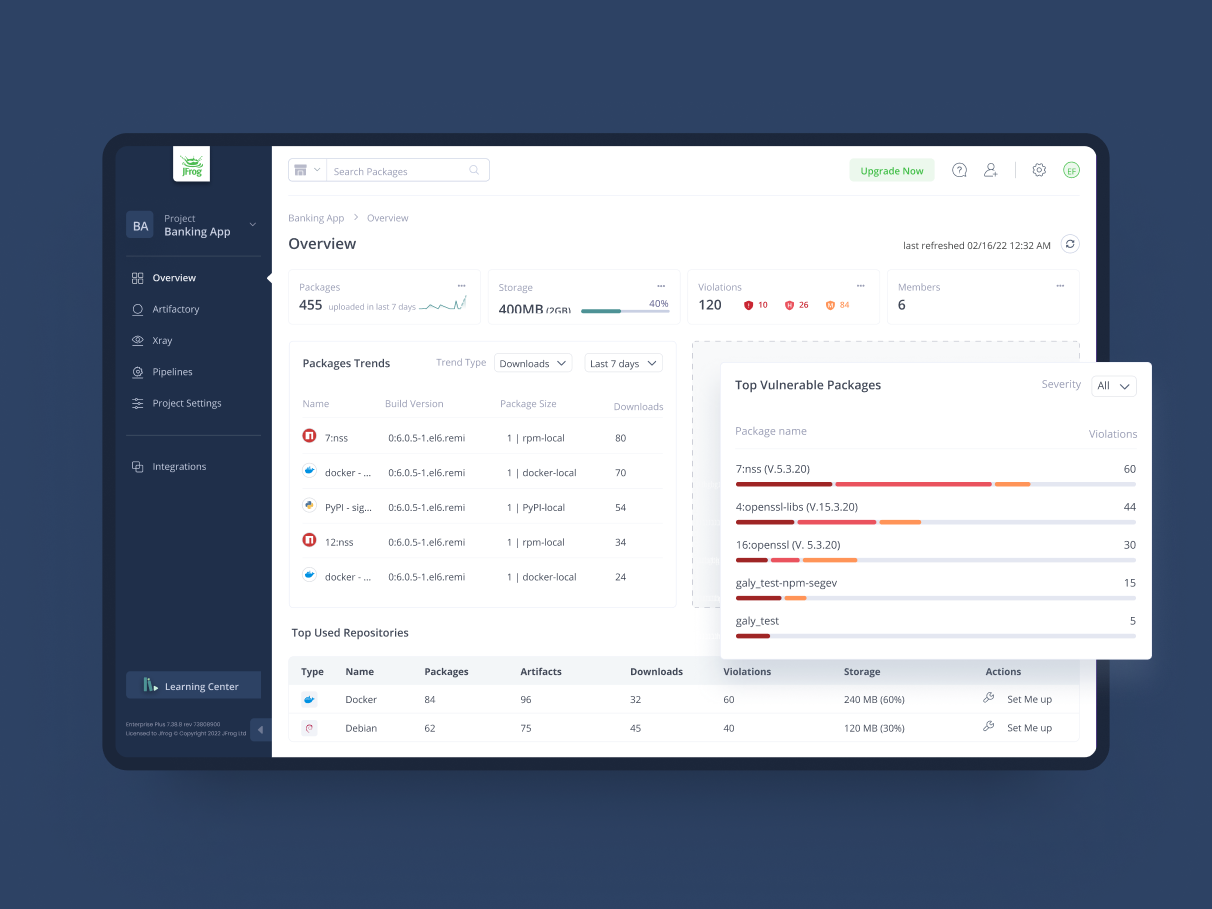
Report
The enhanced report module allows for a high degree of customization, enabling users to generate detailed reports on campaign performance across different metrics and dimensions, supporting data-driven marketing strategies.
This content structure addresses the main problems while providing a clear narrative of the process from identifying issues to implementing solutions. It's concise, informative, and tailored to showcase the project's scope and impact.